Under the Hood
How It Works
Every monitoring cycle runs all targets in parallel. Breaching a threshold automatically triggers a full diagnostic sweep and email alert — no manual intervention required.
Real-time ICMP packet loss detection, automated diagnostics, multi-target correlation analysis, and rich HTML email alerts — deployed in minutes as a Windows service.
Every monitoring cycle runs all targets in parallel. Breaching a threshold automatically triggers a full diagnostic sweep and email alert — no manual intervention required.
Built for real network engineers. Every feature was designed to answer the question a sysadmin asks when something breaks at 2 AM.
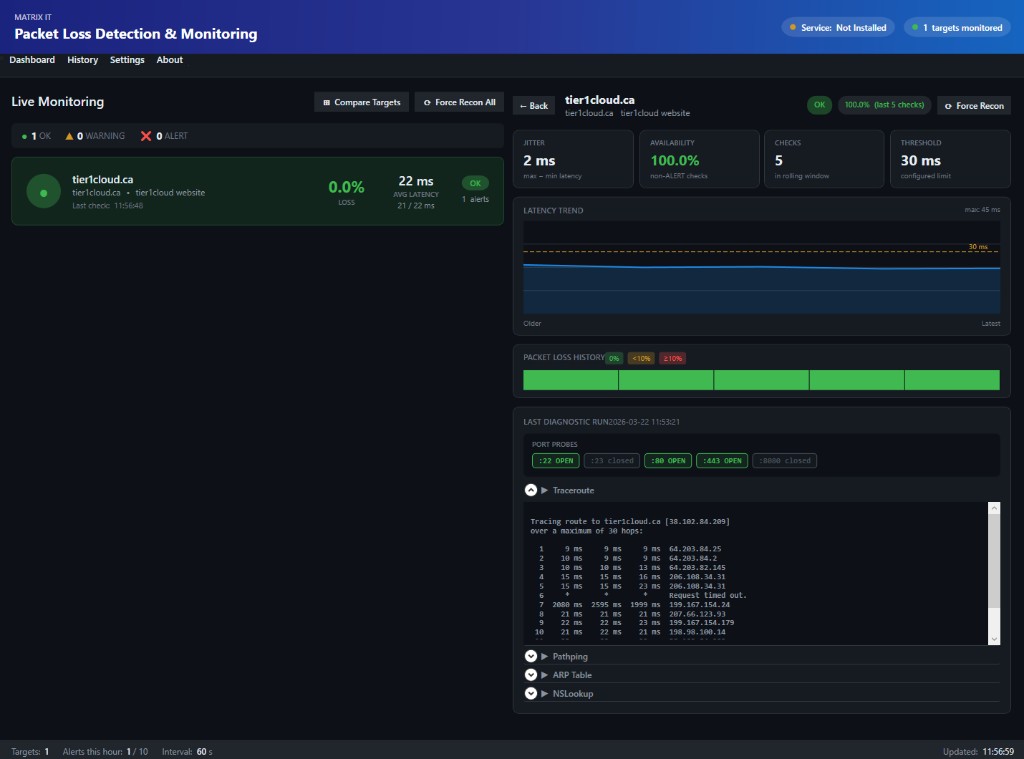
Real-time card grid showing all targets at a glance. Click any card to open the full analytics panel.
When a threshold is breached, five diagnostic tools fire automatically — no manual SSH required.
Rich HTML email alerts with all diagnostic output embedded inline. Cooldowns prevent alert storms.
Click any target card to open a full drill-down panel with charts, heat strips, and diagnostics.
Compare up to 8 targets simultaneously to identify shared path failures vs independent issues.
Run headless as a Windows service. Survives reboots. Managed entirely from the About tab — no command line.
Click any target card on the Dashboard to open the full analytics panel inline. All data is computed from the live rolling buffer — no database required.
Canvas-drawn polyline with filled area, amber dashed threshold line, and grid lines at 25/50/75% of the y-axis scale.
120 colour-coded rectangles — one per check. Green for 0%, amber for under 10%, red for 10% or above. Pattern shapes tell the story instantly.
Jitter computed as max minus min latency across the window. Availability as percentage of non-ALERT checks. Both update live every cycle.
The Force Recon button triggers tracert, pathping, ARP, nslookup, and port probes immediately without waiting for a threshold breach.
The most powerful troubleshooting tool for network admins. Compare degradation patterns across all your targets simultaneously to find shared path failures in seconds.
The correlation engine scores simultaneous degradation between every pair of selected targets. High correlation means they share an upstream path. Low correlation means independent issues — investigate each device separately.
Opens as a non-modal floating window so you can watch correlation update live while monitoring continues.
Every alert email includes the full diagnostic output inline — traceroute, per-hop pathping loss, ARP table, DNS result, and TCP port probes. No need to SSH in to gather data — it's already in the email.
No server setup. No cloud account. No configuration files to hand-edit. The Settings UI guides you through everything.
Run the single-file Setup.exe installer. It installs the app, creates a desktop shortcut, and optionally registers the Windows service — all in under 2 minutes.
The app opens directly to Settings on first run. Add your monitoring targets (hostname or IP), enter SMTP credentials for alerts, and set your thresholds. Hit Save.
The app runs silently in the system tray. You receive an email only when something breaks — with the full diagnostic output already inside. No babysitting required.
Use the interactive desktop app for real-time visibility, or install the Windows service for silent headless monitoring that survives reboots.
Full dark-themed WPF application with live dashboard, analytics charts, history viewer, and Settings editor. Runs in the system tray.
Install as a Windows service via the About tab. Monitoring continues in the background with no GUI — ideal for servers and unattended workstations.
C:\packetmonitor\config.jsonProfessional network monitoring, built for Windows, free forever.
100% Free · No licence · No cloud account · No telemetry
New to the app? Read the User Guide → for installation walkthrough and full feature reference.
Developed and maintained by Matrix IT · 613-232-0648 · Ottawa, Canada